Feathercoin Transactions and mining Difficulty ~4 Days / 5000Blocks 06/07/2017
-
Feathercoin - Analysis of Block Time, Difficulty and Transactions quantity and values.
Overview and Conclusions
The Feathercoin difficulty has increased to an average value of 40, equivalent to a 5 times increase in miners. The hash variations is virtually proportional to previous analysis.
This analysis is a check of blockchain timings and activity. Over 5000 Blocks Hours … from 2nd to 06/07/2017
The average block time over 4 Days is good at 1:03 mins
The percentage of blocks with transactions was ~40% of blocks. The transfer to fee rate is also higher at 128%
There were 12 minor time anomolies in the blockchain timings for the 5000 min test peroid. 5 of those time anomalies were Blocks with the same time.
Low Fees
There were 3 low fee anomalies paying 50FTC instead of 80.
Investigation showed these all to be from one p2pool server. Two of the address were investigated as they appeared to be invalid. Without access to the pool logs it is difficult to give an exact reason, but the current theory is an error handling in p2pool triggered the low fee.
Feathercoin Block Analysis
FTC is routinely analysed if there are any concerns. These analysis are stored on Github to use as templates or review historical analysis.
Values of the parameters analysed can be extracted from FTC debug file. The ABE software used to produce sites such as http://explorer.feathercoin.com/chain/Feathercoin?count=1000&hi=1783533 does some of this work for you, so for sporadic analysis of a few days it is convenient to scrape the data from there.
Normally the web site displays up to 100 blocks but this can be expanded manually.
The data is accumulated in a text document, then pasted into the spreadsheet template from the last analysis. Charts and calculations data ranges are corrected as required.
Overview of the 5000 min period up to 06/07/2017
FTC Fees over 4 days 400000 (0.4M)
Transactions less fees 49456692.02 (49M FTC)
1 % Fee to Transaction volume ratio
Percentage Blocks with Transaction 32.70%
Average Block Time 4 days 1:03 minsTime Anomalies
Number Teamporal Anomolies 12.0
Blocks with same block time 5.0
Number Blocks with Low Fee 3.0Low Fees
1787192 2017-07-06 03:43:28 - Fee 50
1784136 2017-07-03 22:18:50 - Fee 50
1782956 2017-07-03 01:48:58 - Fee 50Feathercoin Transaction time data analysis charts 06/07/2017 over 5000 Blocks
Feathercoin Difficulty
This chart shows the variation difficulty as the hash rate of different (coin switching) pools is directed towards FTC. The red chart is seen to vary cyclically at about 15 minutes.
The blue raising line is the block against time. The less variation in has, the straighter this line will be, so it is an indicator of how much the difficulty calculator (eHRC) is being stressed.
Comparing this to previous charts the average difficulty, and the rate and frequency of variation have increased. It looks like there are more switching pools forming some more complex time signature patterns.
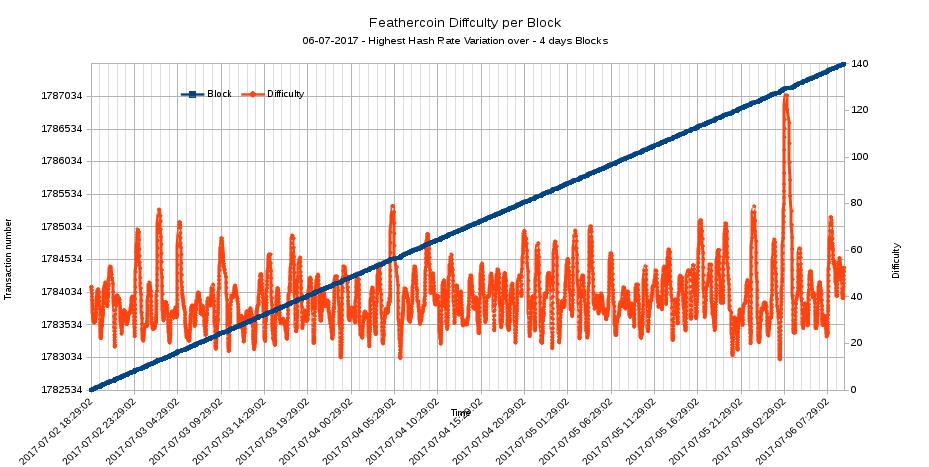
This chart shows the average transaction time over 10 blocks average :

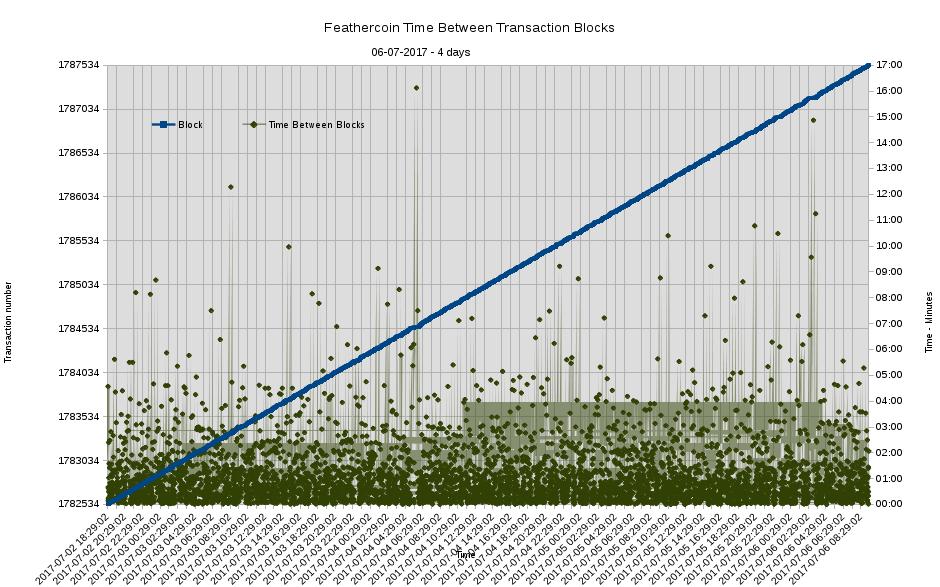
Feathercoin Block Times
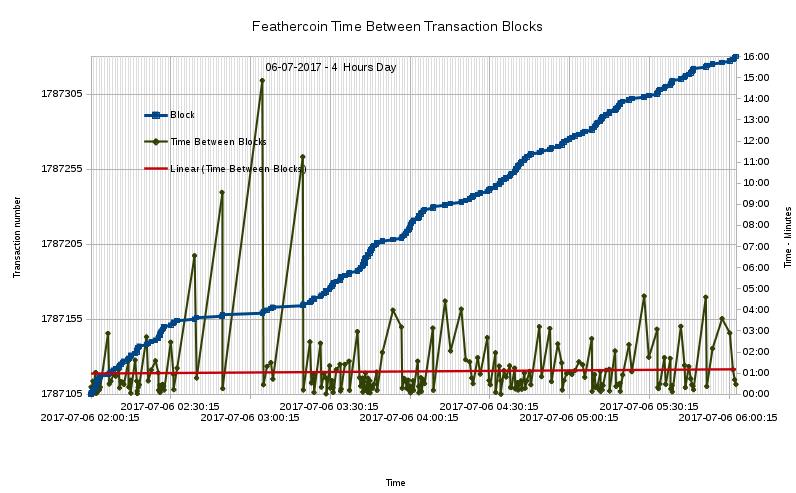
In this chart the green lines show the actual block times. In this case there was one high block times > 10 mins, and there were more block times > 10 mins than usually seen.
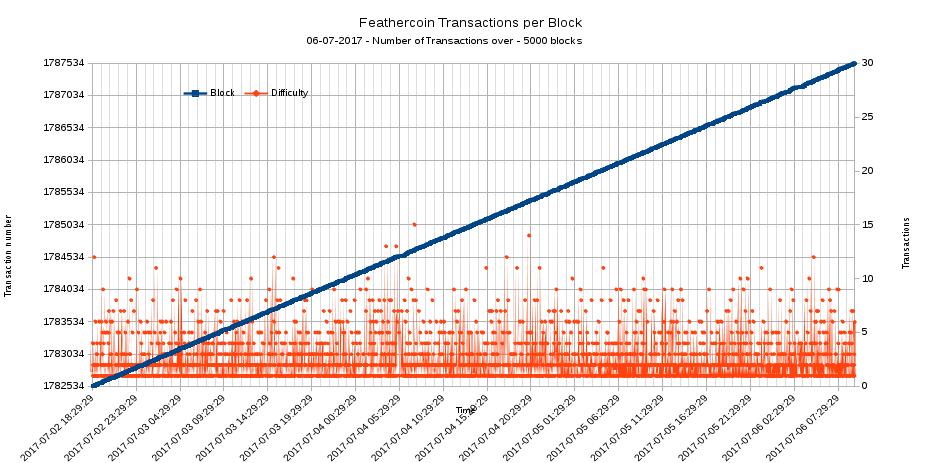
Feathercoin Number of Transactions
This chart shows the normal level of transactions, scaled down.
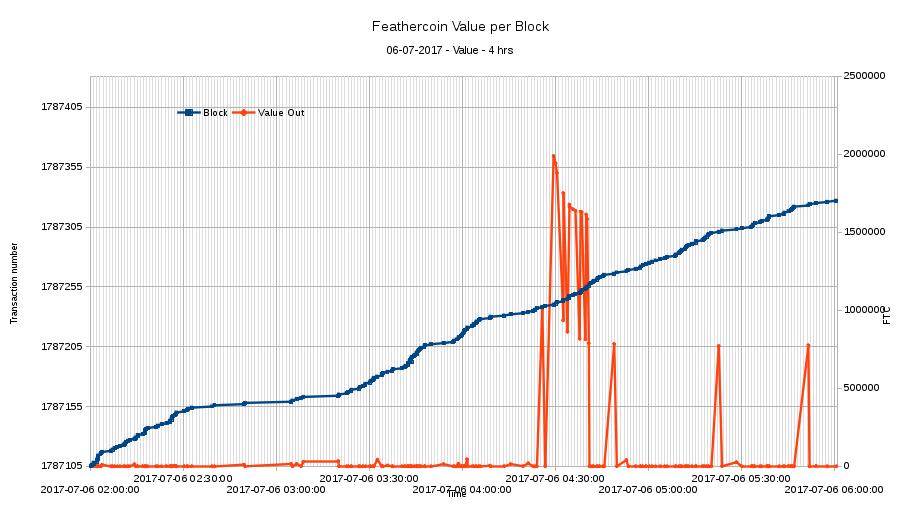
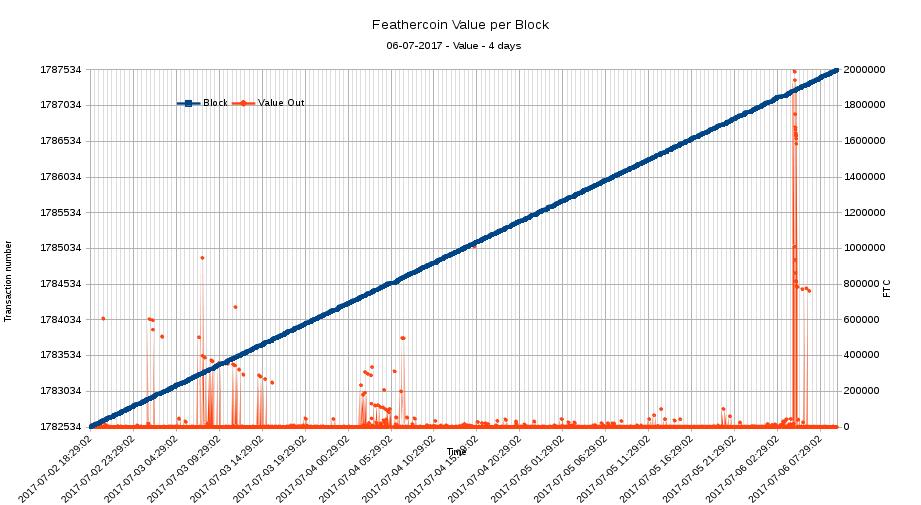
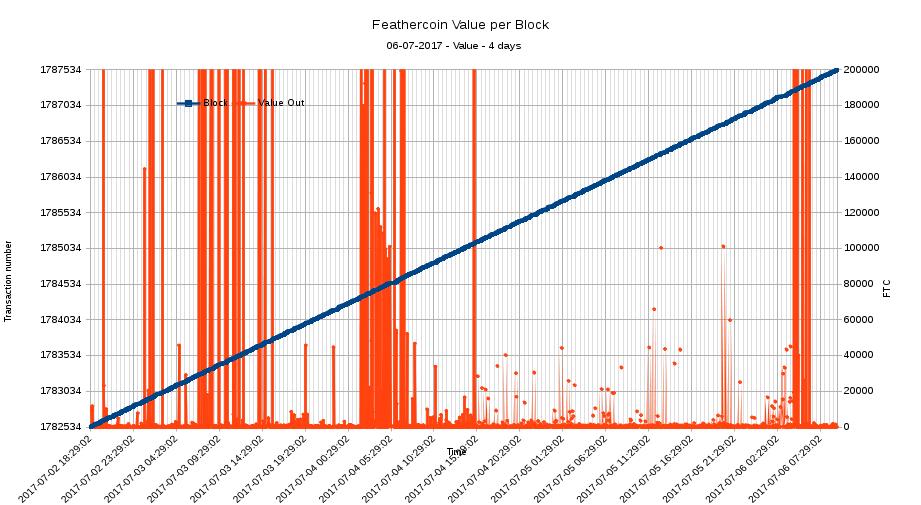
Feathercoin Value of Transactions
This scaled chart shows the value of transactions level.
This scaled chart shows the value of transactions level, scaled down to show lower volume detail.
Analysis of High Difficulty
The highest difficulty / Hash rate directed at Feathercoin Blockchain was at around 2:30 am GMT 06/07/2017
This chart shows the surrounding 4 hour period zoomed in. It can be seen that eHRC reacts and increases the Difficulty.
The slope of Blocks blue line shows the level of “attack”. The straighter the line the less adjustment of the difficulty has to take place to maintain the 1 minute block times.
The chart show vertical lines where each of the blocks would have occurred optimally.
Feathercoin difficulty zoomed in to 4 hours around 3am 6/7/2017
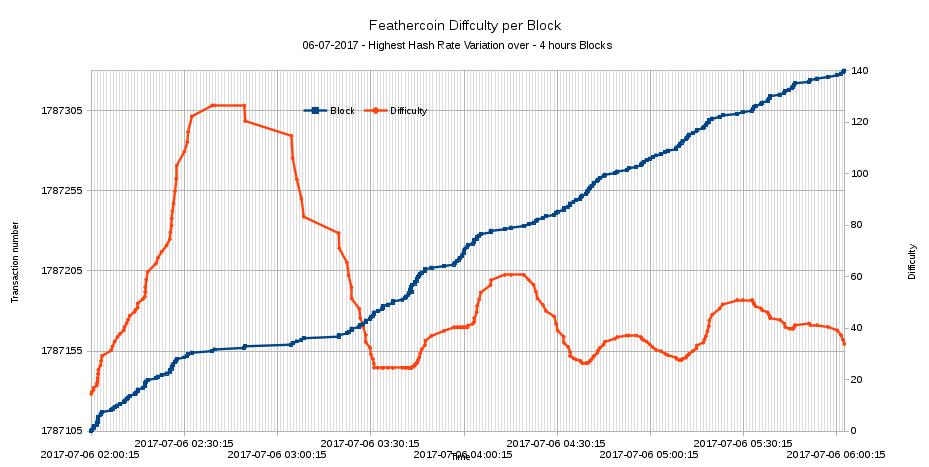
The highest difficulty / Hash rate directed at Feathercoin Blockchain was at around 2:30 am GMT 06/07/2017
This chart shows the surrounding 4 hour period zoomed in. It can be seen how the block times are affected and how eHRC tries to maintain one minute intervals.
The red line shows the average been pushed up to ~1:10 secs for the period.
Feathercoin block times zoomed in to 4 hours around 3am 6/7/2017
This chart shows the number of transactions for the period of high difficulty. There appeared to be a “low to normal” level of transactions.
Feathercoin transaction frequency zoomed in to 4 hours around 3am 6/7/2017
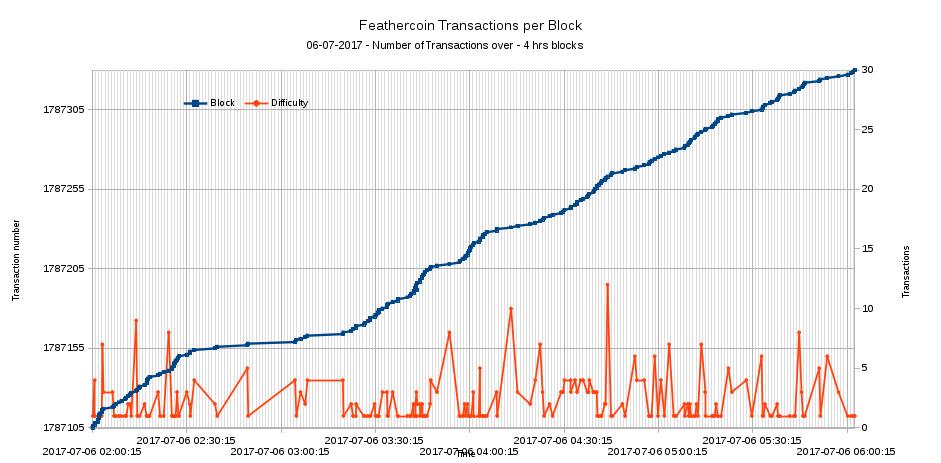
This chart shows the value of transactions for the period of high difficulty. There appeared to be a “low to normal” level of transactions. It can be seen there are some high value transactions not strictly associated with the high difficulty.
Feathercoin Transaction values zoomed in to 4 hours around 3am 6/7/2017
